Wednesday, 3 April 2019

2019 ELECTIONS: Will Perceptions About the Economy matter?


Introduction

Examining the determinants, specifically economic determinants, of elections has been an important research activity in the discipline of public choice. Around election times, not just economists, but talking heads on TV channels seek to divine the outcome of elections on the basis of a smorgasbord of economic and other determinants. Many of them, possibly without knowing it, are being influenced by Edward Tufte’s oft-quoted statement: “When you think economics, think elections; when you think elections, think economics” [2].

The literature in this area distinguishes between Vote Functions and Popularity Functions. In estimating popularity functions, one tries to estimate the approval rating of the government or the political party in power while vote functions seek to explain the voting choice itself [3]. As an election approaches, but before the voting actually begins, the agenda is to gauge the popularity of the incumbent political party on the basis of its performance. Performance is generally evaluated on the basis of the actual state of the economy as conveyed by data on macroeconomic variables. Vote functions are estimated after the event to try and understand voting behavior and to determine which factors might have been important in the voters’ choice. Even though popularity functions have been estimated for a long time, especially in the United States, there is no consensus on which macroeconomic variables have a predictable impact on the popularity of the government [4]. Nate Silver makes a similar point [5]. Over time, popularity functions have progressed from using actual data on macroeconomic variables to voters’ perceptions about the state of economy. It is worth pondering whether the subjective perceptions about the state of economy match the actual state of the economy as evidenced by hard data.

Estimating popularity functions for India is not well-established because sufficiently long time series data are not yet available. However, since 2011, the Reserve Bank of India has been carrying out Consumer Confidence Surveys (CCS) [6]. The CCS of September 2011 described the exercise as follows: “It [CCS] gives an assessment of the consumer sentiments of the respondents based on their perceptions of the general economic conditions and own financial situation. The assessments are analysed in two parts, viz., current situation as compared to a year ago and expectations for a year ahead” [7]. However, estimating popularity functions is hampered due to the paucity of data on the popularity of the government or the ruling party. Lokniti has been reporting such data in its Mood of the Nation surveys [8]. However, the time series is not long enough to estimate popularity functions. More than twenty-five years ago, in one of the earliest studies in the area, I had tried to estimate popularity of the government using bye-election results [9]. However, bye-elections do not take place at regular intervals making it difficult to relate popularity of the government using bye-elections with macroeconomic data – whether actual data or perceptions of such data – that have been collected at regular intervals of time.

RBI Consumer Confidence Surveys

The earliest RBI Consumer Confidence Surveys is for September 2011 [10]. This CCS covered the cities of Bangalore, Chennai, Hyderabad, Kolkata, Mumbai and New Delhi. 900 respondents were selected from each city yielding a sample of 5,400 respondents. Over the years, the coverage of the CCS has increased and the last one available for December 2018 covered 13 cities – Ahmedabad, Bengaluru, Bhopal, Chennai, Delhi, Guwahati, Hyderabad, Jaipur, Kolkata, Lucknow, Mumbai, Patna and Thiruvananthapuram - and obtained 5,347 responses [11]. The questions asked of respondents covered the following topics:

1.    Perceptions and Expectations on General Economic Situation
2.    Perceptions and Expectations on Employment
3.    Perceptions and Expectations on Price Level
4.    Perceptions and Expectations on Rate of Change in Price Level (Inflation)
5.    Perceptions and Expectations on Income
6.    Perceptions and Expectations on Spending
7.    Perceptions and Expectations on Spending- Essential Items
8.    Perceptions and Expectations on Spending- Non-Essential Items

Perceptions are about the current situation and respondents are asked if they believe there has been an improvement, a worsening or no change as compared to a year ago. The percentage of respondents who state that there is a worsening is subtracted from the percentage of those who state there is an improvement while ignoring those who feel there has been no change. This difference is labelled Net Response (NR), a positive value of which suggests an overall improvement while a negative value suggests a worsening situation. Expectations are generally in terms of anticipated changes over the next one year for which as well the NR is computed [12].

Reading the Tea Leaves…

In this section, I try to make some sense of the results of the RBI’s CCS. To begin with let us consider the General Economic Situation.

General Economic Situation

Figure 1 shows the NR for the current situation and for expectations.
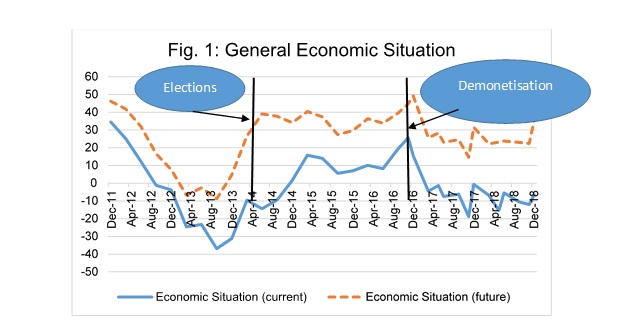


The dismal NR for the current economic situation in the last few quarters of the UPA regime before the 2014 Elections was a clear indication of imminent change. For over a year after the 2014 Elections, there was a significant improvement in NR till the economy was hit by the shock of Demonetisation. NR plummeted in the post-demonetisation period reaching negative values. There is much greater optimism regarding the future economic situation with a large percentage of respondents expecting an improved economic situation one year down the line.

The pessimism about the current economic situation is not as bad as it was just prior to the elections of 2014 but it should be remembered that the UPA was facing those elections after having ruled the country for ten years. The NDA, which has had the largest majority in Parliament in 30 years, is facing a pessimistic electorate at the end of only its first term in office. Table 1 shows the comparison between UPA and NDA regimes.

Table 1: General Economic Situation – Average Net Response
General Economic Situation (current)
General Economic Situation (future)
UPA: ONE YEAR PRIOR TO 2014 ELECTIONS
-25.12
2.62
NDA: BEFORE DEMONETISATION
7.59
36.39
NDA: AFTER DEMONETISATION
-6.17
26.69

  
Table 1 shows that the pessimism at the end of UPA’s rule was much deeper than it is for the NDA and this was true for both the current and the future economic situation. Nonetheless it is not a comfortable situation for the NDA and this is seen in the anxiety, especially of the BJP, to steer the conversation away from the economy towards issues related to national security and nationalism. But more on that later.

Employment

In Figure 2, I look at the CCS component on employment.


The pessimism with respect to current employment is the worst that it has been seen since the start of CCS. In fact, the NR for current employment turned negative in the survey of March 2016 but, surprisingly, it was positive at 6.2 in November 2016, the month in which demonetisation was announced. After demonetisation, the NR has been persistently negative. This lends substantial credibility to the estimates of the NSSO that unemployment in India has reached a 45 year high [13]. Expectations of employment have also been lowered in the aftermath of demonetisation.

Table 2 presents a comparison of the situation with respect to employment during the UPA and NDA regimes.

Table 2: Employment Situation – Average Net Response
Employment Situation (current)
Employment Situation (future)
UPA: ONE YEAR PRIOR TO 2014 ELECTIONS
1.58
25.24
NDA: BEFORE DEMONETISATION
3.75
38.85
NDA: AFTER DEMONETISATION
-10.25
28.35

The average NR with respect to current employment situation during the post-demonetisation period is much worse than that seen towards the end of the UPA regime. Even as far as employment prospects are concerned, there is 10 percentage points drop in the score – from 38.85 to 28.35 – between the two periods of the NDA rule.

Income

Finally, in Figure 3, Net Responses for Income are presented.


The fall in perceptions about current income does not sit well with the claims that India has been growing at a rapid rate during the NDA rule. Perhaps, there is some truth in Raghuram Rajan’s doubts about whether India is growing at 7% per annum at all [14]. NR for future incomes, however, show a rise from December 2017.

Table 3 presents a comparison of the UPA and NDA regimes for the income situation.

Table 3: Income Situation – Average Net Response
Income (current)
Income (future)
UPA: ONE YEAR PRIOR TO 2014 ELECTIONS
22.24
40.88
NDA: BEFORE DEMONETISATION
16.73
46.59
NDA: AFTER DEMONETISATION
2.80
42.56

The average NR for current income at 2.80 is the lowest in the three time periods considered in Table 3.

Conclusions

Questions may be asked whether the respondents are misreading the economy and whether their pessimistic perceptions are not a sign of inadequate information as well inadequate information processing. That may well be true and this becomes evident from the Net Responses for inflation and price level (not reported here). The NR for both have been negative right from the first survey till the latest. While negative NR might have been appropriate during the UPA regime when inflation was running high, these may be mistaken for the NDA regime when inflation has come down substantially. Howsoever mistaken the perceptions might be, political parties have to live with these: if the economy matters in the voters’ decision making, perceptions will play a more dominant role than “objective” reality or hard data. As “Kahneman and Tversky showed that…human beings hardly behave as if they were trained or intuitive statisticians” [15].

It is now reasonably well-established in the literature that the state of the economy is always a pertinent issue in any election campaign [16]. In this context, the responsibility hypothesis of Lewis-Beck and Paldam tells us that voters hold the government responsible for economic events and that we can bring into the picture voter perceptions of the economy [17]. Negative perceptions about the state of the economy spell trouble for any incumbent as the UPA found out in the previous elections. The NDA government also faces negative perceptions about the handling of the economy especially with respect to employment. The question remains whether voters are sufficiently disenchanted with the present government to vote it out. That is a difficulty question to answer for a variety of reasons.

1. We do not know how exactly perceptions about the economy are transformed into voting 
    decisions: the paucity of data do not allow us to make any inference.
Voting out the government requires an alternative who can capture the negative votes
    against the government
3. Non-economic issues gain prominence over economic issues deflecting attention away
   from the negative perceptions

For the NDA government, issues surrounding voter perceptions are not academic but rather existential issues. If there is the slightest risk that negate perceptions might harm its re-elections prospects, it must (and it has been doing so!) bring to prominence non-economic issues that steer the discussion away from economic issues. Of course, to be on the safe side, the government has suppressed unpalatable data (e.g. NSSO report on unemployment) and it has also got the Niti Ayog to massage the GDP data in such a way that the NDA performance seems better than that of the UPA.

Sometimes fate intervenes to give the incumbent an advantage: the Pulwama terror attack, however tragic and ghastly it undoubtedly was, did give the BJP the opportunity to display its muscular nationalism. For the past several weeks, the campaign battle has seen the opposition parties seeking to focus attention towards the economy while the BJP has been dragging the conversation towards nationalism and security. In Narendra Modi the opposition is facing a master campaigner who is not above twisting facts so as to put the opposition on the defensive. Likewise, genuine questions to the government have been mauled out of context to extract political mileage. For example, questions about BJP’s claims about casualties in the air strike in Balakot [18] were falsely portrayed as the opposition questioning the Indian armed forces [19]. This is such a far cry from the strategy followed by Mr. Narendra Modi in 2014 when catch phrases such as ‘Achhe Din’ and ‘Sab ka saath, sab ka vikas’ rent the air. As Shekhar Gupta correctly puts it, for the 2019 elections, Mr. Modi is not seeking votes on the basis of his government’s economic performance but on the basis of national security [20].

Will the BJP’s messaging and rhetoric on nationalism be sufficient to divert attention away from its obvious failings on the economic front? Will the opposition be able to drag back the discourse towards economic issues? And, most importantly, how will the mix of economic and non-economic issues play out in the minds of voters as their hands hover over Electronic Voting Machines in polling booths across India?  We will get our answer by the middle of May 2019.

ENDNOTES:

1.       I would like to thank Manali Phatak for collecting and organizing the data on RBI’s Consumer Confidence Surveys.
2.    Tufte, E.R. (1978) Political Control of the Economy, Princeton University Press, Princeton, NJ, USA.
3.    Lewis-Beck, M.S. and Stegmaier, M. (2013) The VP-function revisited: a survey of the literature on vote and popularity functions after over 40 years, Public Choice, Vol. 157, No. 3/4, pp. 367-385 (https://www.jstor.org/stable/24507619?seq=1#page_scan_tab_contents)
4.    Lewis-Beck and Stegmaier (2013) ibid.
5.    Nate Silver (2012)Measuring the Effect of the Economy on Elections https://fivethirtyeight.blogs.nytimes.com/2012/07/05/measuring-the-effect-of-the-economy-on-elections/
6.    Reserve Bank of India (various years) Consumer Confidence Survey, https://rbi.org.in/Scripts/QuarterlyPublications.aspx?head=Consumer%20Confidence%20Survey
7.       Reserve Bank of India (2011) Consumer Confidence Survey : September 2011, https://rbi.org.in/Scripts/PublicationsView.aspx?id=14028
8.   Lokniti (2017) Mood of the Nation Surveys, https://www.lokniti.org/other-studies
9.   Karnik, A. (1990) “Elections and Government Expenditures: The Indian Evidence”, Journal of Quantitative Economics, Vol. 6, pp. 203-212
10. RBI (2011) Consumer Confidence Survey : September 2011, https://rbi.org.in/Scripts/PublicationsView.aspx?id=14028
11. RBI (2019) Consumer Confidence Survey: December 2018, https://rbi.org.in/Scripts/PublicationsView.aspx?id=18776
12. The methodology of analyzing the CCS is given here: https://rbi.org.in/Scripts/PublicationsView.aspx?id=14028#A2 in Annex II.
13. Sharad Raghavan, T.C.A. and Jebaraj, P (2019) National Sample Survey Office’s unemployment data confirms crisis on the ground: experts, https://www.thehindu.com/news/national/national-sample-survey-offices-unemployment-data-confirm-crisis-on-the-ground-experts/article26141744.ece
14. Economic Times (2019) Raghuram Rajan raises doubts about India growing at 7%, says cloud over GDP data needs to be cleared, https://economictimes.indiatimes.com/news/economy/indicators/raghuram-rajan-raises-doubts-about-india-growing-at-7-says-cloud-over-gdp-data-needs-to-be-cleared/articleshow/68581012.cms
15. Sunstein, C.R. and Thaler, I (2016) The Two Friends Who Changed How We Think About How We Think, The New Yorker, December 7, https://www.newyorker.com/books/page-turner/the-two-friends-who-changed-how-we-think-about-how-we-think
18. Langa, M. (2019) Air strike killed more than 250 terrorists, says Amit Shah, The Hindu, March 4 2019, https://www.thehindu.com/news/national/other-states/air-strike-killed-more-than-250-terrorists-says-amit-shah/article26430065.ece
19. DD News (2019) FM Arun Jaitley slams those who question armed forces, http://ddnews.gov.in/national/balakot-airstrike-was-not-revenge-action-fm-arun-jaitley
20. Gupta, S. (2019) Modi’s 2019 mantra: Forget achhe din, fear terror, Pakistan, Muslim, The Print, https://theprint.in/national-interest/modis-2019-mantra-forget-achhe-din-fear-terror-pakistan-muslim/214495/

Saturday, 5 May 2018

Karnataka: Description in a Few Charts

The election campaign in Karnataka has seen a new trend: challenges being thrown to opponents to speak for 15 minutes on some issue deemed to be important. Mr. Rahul Gandhi challenged Mr. Narendra Modi to speak in Parliament; Mr. Modi challenged Mr. Gandhi to speak on the achievements of the Karnataka government; Mr. Siddharamiah challenged Mr. Modi to speak on crime and so on.

In keeping with the spirit of brevity, this post presents a picture of Karnataka in a few charts.

State of the Economy

The charts in this section provide information on various sectors of the economy over the term of the current UPA government in Karnataka and that of the previous NDA government. Even though both governments were coalitions, in the charts below, I take the liberty of labelling them by the main party in each coalition. The charts present yearly growth (the orange line graph) rates as well the average rate for each government (the blue bar graph).


Summary Evaluation:  There can be little doubt that the present UPA government has performed much better than the previous NDA government as a far as the overall economy is concerned as well as the various sectors of the economy.


Government Finances

The charts in the section highlight the state of government finances.


Summary Evaluation: The NDA government seems to have done better than the current UPA government. The own-tax revenues were higher under NDA and the revenue deficits were lower. The UPA government has done better in terms of keeping the gross fiscal deficit in check.

Conclusion

The charts above show the present UPA government in a much better light than the earlier NDA government even though its performance as far as government finances are concerned has slipped below that of the previous government.

Saturday, 21 October 2017

DEMONETISATION AND EMPLOYMENT


Introduction

It has been almost a year since Prime Minister Modi surprised the country with the announcement of demonetisation. Numerous commentators had criticized the move for a variety of reasons, the most prominent among these being:

(1) Demonetisation was the wrong instrument for the intended objective of eliminating black money from the Indian economy.

(2) The economy would suffer a severe adverse shock as a result of the draining of 86% of the currency from the system.

This blog had written about these criticisms and added some of its own.[1] At that time, much of the criticism was on conceptual grounds, given the importance of cash in the Indian economy. The government itself realized that the original objective of eradicating black was unlikely to succeed and kept changing the narrative. After mentioning “black money” eighteen times in his fateful November 8 2016 speech, the Prime Minister and his colleagues gradually changed the narrative to include the objectives of cashless economy, curbing of terrorism, long term growth and so on. In a revealing content analysis of the Prime Minister’s speeches, IndiaSpend.com reported that, by the end of November 2016, references to black money had fallen substantially, references to fake currency had all but disappeared and cashless economy, which was not mentioned at all in his November 8 speech, had risen high enough to become the primary objective of demonetisation.[2]

As time has passed since the withdrawal of currency from the Indian economy, evaluation of the move is no more based on only a theoretical understanding of the Indian economy; this is now being supplemented by hard data. I had written about this in June 2017 as I tried to explain the agitation of farmers.[3] Much of the recent analyses have validated the fears that had been expressed in the immediate aftermath of demonetisation. It is important to bear in mind that reports from even respectable Indian institutions have started to point towards the adverse consequences of demonetisation. A recent RBI report pointed out that almost all the currency notes that had been extinguished, had made their way back to the banks. Of the currency worth Rs. 15.45 trillion withdrawn from the economy, “the estimated value of SBNs [specified bank notes i.e. currency notes] received as on June 30, 2017 is Rs. 15.28 trillion”.[4] This has belied the expectation that almost 30% of the banned notes would not be returned[5] and would, in effect, represent black money that had been “burned” by holders of such monies.

Among the commentators who have strenuously defended demonetisation Bhagwati, Dehejia and Krishna are the most high profile with rather exalted academic standing. Bhagwati et al have been at pains to point out that demonetisation did have some beneficial effects on the Indian economy although their list of benefits seems to depend on a number of assumptions, most notably, how much may be collected in the form of taxes from the monies deposited into bank account.[6] As an aside, I must mention that the title of their paper (“It’s premature to argue if demonetisation was a success or failure”) reminds me of the interesting but, possibly, apocryphal story of Zhou Enlai, the Chinese Premier from 1949-1976.[7] When asked about the impact of the French Revolution, Zhou apparently said “It’s too early to tell”.[8]

The most specious claim made in aforementioned article of Bhagwati et al is in its last sentence. Referring to the apparent boost to digital banking and digital transactions due to demonetisation, they write: “We would note that while this was not the original intended goal of demonetisation, it may yet prove the most important long-lasting benefit”. If something was not intended, then its occurrence is serendipitous and serendipity cannot be used to bolster one’s support for a policy. Also, if unintended benefits are to be claimed as positives for demonetisation, then unintended costs should also be included on the negative side: who had, for instance, anticipated that 40 persons would die while standing in the long queues that had formed for the purpose of depositing defunct notes into the banks? This was a tragic occurrence in the aftermath of demonetisation which needs to be taken into account unless, of course, such deaths are seen as minor collateral damage. And there is no estimate of how much productive time was lost by employed individuals while standing in these queues.[9] The sheer one-sided evaluation of demonetisation by Bhagwati et al is neatly exposed by Shruti Rajgopalan and Lawrence White[10] in their comments on an earlier article by the trio.[11] Rajgopalan and Lawrence point out that Bhagwati et al, instead of carrying out a cost-benefit analysis of demonetisation, carry out only a simplistic benefit analysis of it.

Employment and Demonetisation

It has been pointed out that demonetisation has resulted in the extinguishing of jobs, especially in the informal sector.[12] The CMIE has estimated that 1.5 million jobs were lost during the period January-April 2017.[13] Alongside this reported loss of jobs there has been a decline in the labour force participation rate (LPR).[14] However, the unemployment rate (UR)[15] and the LPR show divergent trends in the post-demonetisation time period. Mahesh Vyas of CMIE does try to explain this but his explanation does not seem convincing to me.[16] Figure 1 shows the trends in Total (All India) UR and Total LPR.[17]


The reported job losses are not reflected in the unemployment rate but the declining LPR shows that persons are dropping out of the labour force. This is a phenomenon that was witnessed in the USA also during the recent recession: the dismal jobs situation led many to drop out of the labour force i.e. they stopped searching for jobs. As per the FRED database, LPR in the USA fell from 66% in September 2008 to a low of 62.4% in September 2015 before beginning to recover.[18] A mere visual examination of the data for India does not seem to suggest that LPR began to fall only after demonetisation in November 2016 since it shows a fall in October 2016 as well. Could the fall have accelerated after demonetisation? I examine this in a later section.

Figures 2 and 3 show LPR and UR for Urban and Rural sectors. The trends in LPR and UR for urban and rural areas are no different from those for Total LPR and Total UR.


LPR and Demonetisation

It has often been stated that India has a young population. Many countries in Asia seem to be moving in the other direction i.e. their population is aging but, in India, approximately half the population is under the age of 26, “and by 2020, it is forecast to be the youngest country in the world, with a median age of 29”.[19]  IndiaSpend.com reports that 64.4% of India’s population is in the 15-59 years age group. This number is 67.7% for urban India and 62.9% for rural India.[20] With this distribution of population it seems inconceivable that LPR can show a declining trend unless something dramatically unusual is happening in the Indian economy. World Bank data tells us that from 2012 to 2016, the Indian labour force has increased by 34.5 million, that is, an average yearly increase of 8.6 million[21] and yet, unexpectedly, the LPR ratio shows a sudden fall.

For the USA, which has also faced the problem of declining LPR, FRED (Federal Reserve Bank of St. Louis)[22] has put forward two reasons for this phenomenon (See also James Bullard[23] and Maria A. Arias and Paulina Restrepo-Echavarria[24])

(1) The “demographics” view, which states that the changes in the rate are a reflection of changes in the demographics of the labor force

(2) The “bad omen” view, which says that the declines in the LPR rate are due to people leaving the labor force because of the poor state of the economy

Bullard, after evaluating all the evidence, comes to the conclusion that the demographics view best explains the declining LPR in the USA: “The nation’s workforce had a younger profile as the Baby Boom generation came of age, and it will have an older profile as the Baby Boom generation continues to retire. Since different age groups have different propensities to participate, this suggests a promising avenue to explain the labor force participation data”.

Clearly, India’s demographic history is completely different from that of the USA. India does not have the equivalent of the baby-boomers generation which might be retiring now. In fact, as stated above, India’s demographic profile suggests that more and more individuals should be entering the job market. That apart, the LPR in the USA has declined over a few years which is to be expected since demographic variables change slowly. In India, the LPR has declined within a span of a couple of months thereby rejecting the demographic explanation of a declining LPR. Consequently, the only explanation that holds some credibility is the “bad omen” view. The state of the economy, already fragile before the shock of demonetisation, nosedived after November 2016 causing the unexpected decline in LPR.

Declining LPR: Empirical Verification

I carry out some exercises to show the link between LPR and demonetisation. A simplistic exercise would be to run a regression of Total LPR on a binary variable representing demonetisation. The results of such as an exercise would reveal a picture like Figure 4.


The vertical line at November 2016 divides the plot area into two segments: before and after demonetisation. Even though I don’t show it here, but similar graphs for Urban LPR and Rural LPR can be created.

I extend the above analysis by linking LPR to the amount of currency with the public (CURR) which in turn was affected by demonetisation. In the language of econometrics, I endogenise CURR and use demonetisation (which I believe to be an exogenous, unanticipated event) as an instrument. My reasoning for linking LPR to CURR is that almost the entire informal sector depends on cash for its transactions. The withdrawal of 86% of the currency from the economy dealt a blow to production of this sector rendering millions jobless. The "bad omen" effect of loss of jobs led to an adverse effect on LPR. Nakamura and Steinsson have cautioned that exogenous monetary policy shocks should be identified carefully since many apparent shocks seem to have been triggered for identifiable economic events and are, hence, not truly exogenous.[25] There is reason to believe that demonetisation was not triggered by any prior identifiable economic events.[26]

I now report the results of my empirical exercises. For those interested, the Appendix gives details of the econometrics. Using the results of the equation reported in the Appendix, I chart out the estimated path of LPR and compare it with a counter-factual path, namely, a path that LPR would have taken if demonetisation had not taken place (Figure 5). I show this only for Total LPR since the charts for Urban LPR and Rural LPR are almost identical.


The blue line shows what did happen in the Indian economy with Total LPR collapsing after November 2016. In contrast, the maroon counterfactual line shows the path LPR would have taken had demonetisation not taken place. The contrast between the two lines clearly shows that demonetisation was responsible for the sudden fall in Total LPR.

Summing Up

The decline in the LPR should be matter of deep concern for the Indian economy. Persons may drop out of the labour force due to discouragement, the inability to find a job.[27] They may not permanently stay out of the labour force and would possibly return when job prospects improve. In the meantime, they may take up part-time jobs to make ends meet or maybe compelled to start a small business as a desperate move for their very survival. A remedy for this dismal state of affairs will not be forthcoming until the government recognizes the reasons behind this phenomenon. Unfortunately, there seems to be little hope of that with the government and its ministers continuing to aggressively defend demonetisation and denying that the economy is in deep trouble. An indication of how poor the government’s understanding of the economic situation is can be gleaned from the callous comment of Railway Minister Piyush Goyal who said that loss of jobs is a good sign since the youth of today would like to be entrepreneurs.[28] Goyal, obviously, does not recognize the difference between the “forced entrepreneurship” of the jobless and those who voluntarily choose to be entrepreneurs.


APPENDIX

I use 2SLS estimation to model Total LPR as a function of Currency with the Public (CURR). However, there are strong reasons to believe that CURR is not truly exogenous and I use a dummy variable (DEMON) to represent pre- and post-Demonetisation periods as an instrument for CURR. The estimated main equation and the first stage regression are given below. The numbers in brackets are p-values.


The endogeneity test confirms that CURR is, indeed, endogenous. The RMSPE tells us that the prediction performance of this equation is very good.

The first-stage regression shows the importance of demonetisation for CURR.


Even though I do not report it here, I get very similar results for Urban LPR and Rural LPR using the same methodology as for Total LPR.


[1] http://ajitkarnik.blogspot.ae/2016/12/demonetisation-thunderbolt-in-search-of.html
[2] http://www.indiaspend.com/cover-story/how-modi-changed-and-changed-the-demonetisation-narrative-54391
[3] http://ajitkarnik.blogspot.ae/2017/06/what-is-agitating-farmers.html
[4] RBI Annual Report, 2016-17, p. 195; https://rbidocs.rbi.org.in/rdocs/AnnualReport/PDFs/RBIAR201617_FE1DA2F97D61249B1B21C4EA66250841F.PDF
[5] https://www.bloomberg.com/news/articles/2017-08-30/india-central-bank-spends-record-amount-to-replace-void-notes
[6] https://theprint.in/2017/09/05/premature-argue-demonetisation-success-failure/
[7] http://www.historytoday.com/blog/news-blog/dean-nicholas/zhou-enlais-famous-saying-debunked
[8] This perfectly good story has been debunked by spoilsports who claim that Zhou was actually referring to the 1968 protests in France. See: https://mediamythalert.wordpress.com/2011/06/14/too-early-to-say-zhou-was-speaking-about-1968-not-1789/
[9] My back-of-the-envelope calculation suggests the following: India’s population is 1.2 billion. Assume that average household size is 5. Hence, there are 240 million households in the country. Assume that only one member for only half of these households had to stand in a queue to exchange defunct bank notes (the remaining household, being better off could get someone to stand in the queues for them). Hence, 120 million individuals stood in queues. Further, assume that each person stood in the queue for only 2 hours (possibly a gross under-estimate): 240 million hours were spent in queues. Assuming a working day of 10 hours, I get an estimate of 24 million person-days were lost in queues.
[10] http://www.livemint.com/Opinion/0RUMX1LvfO8VtMdC4Acd5L/Demonetisation-and-welfare.html
[11] http://www.livemint.com/Opinion/niFH9uM377oUSHEQcRuUWP/Demonetisation-fallacies-and-demonetisation-math.html
[12] https://economictimes.indiatimes.com/markets/stocks/news/deep-impact-of-demonetisation-analysts-count-cost-in-terms-of-job-business-losses/articleshow/56370617.cms
[13] https://www.cmie.com/kommon/bin/sr.php?kall=warticle&dt=2017-07-11%2011:07:31&msec=463
[14] LPR is defined as the ratio of the labour force to the population greater than 15 years of age. Please see: https://unemploymentinindia.cmie.com/kommon/bin/sr.php?kall=wtabnav&tab=4000&sectcode=200150000000000000000000000000000000000000000
[15] Unemployment rate is defined as those who are willing to work and are actively looking for a job expressed as a per cent of the labour force. The source for this is CMIE in the previous endnote.
[16] https://www.cmie.com/kommon/bin/sr.php?kall=warticle&dt=2017-07-11%2011:07:31&msec=463
[17] The source for my data is: (1) https://unemploymentinindia.cmie.com/kommon/bin/sr.php?kall=wtabnav&tab=4020 and (2) CMIE’s Unemployment in India: A Statistical Profile (various issues) (https://unemploymentinindia.cmie.com/)
[18] https://fred.stlouisfed.org/series/CIVPART
[19] https://blogs.thomsonreuters.com/answerson/indias-demographic-dividend/
[20] http://www.indiaspend.com/viznomics/indias-demographic-dividend-64-4-youth-27-3-children-in-2015-2015
[21] https://data.worldbank.org/indicator/SL.TLF.TOTL.IN
[22] https://www.stlouisfed.org/on-the-economy/2017/january/dissecting-falling-labor-force-participation-rate
[23] https://research.stlouisfed.org/publications/review/2014/03/13/the-rise-and-fall-of-labor-force-participation-in-the-united-states/
[24] https://www.stlouisfed.org/publications/regional-economist/october-2016/demographics-help-explain-the-fall-in-the-labor-force-participation-rate
[25] http://www.columbia.edu/~js3204/papers/macroempirics.pdf  I would like to thank Jeremy Edwards for drawing my attention to this article to me though I am not sure if he will agree with my claim that demonetisation was genuinely exogenous.
[26] This can, of course, be contested if one accepts the Prime Minister’s contention that demonetisation was designed to remove black money from the economy. Given how inappropriate the instrument was to curb black money, I find it difficult to accept the Prime Minister’s contention.
[27] https://www.federalreserve.gov/newsevents/speech/yellen20140822a.htm
[28] http://indiatoday.intoday.in/video/piyush-goyal-job-loss-congress-rahul-gandhi/1/1063788.html