N.B.: This post is not a commentary on the Economic Survey which was released on 26 Feb. 2016. My write-up was almost complete by the time Survey was released and, barring one reference, offers no evaluation of it.
-------------------------------------------------------------------------------------------------------------------------------------------------------------------
INTRODUCTION
-------------------------------------------------------------------------------------------------------------------------------------------------------------------
INTRODUCTION
As we approach the third budget of the NDA government, concerns are being expressed about the growth of the Indian economy. The current fiscal year began amid hopes that the growth rate for 2015-16 would be in the region of 8% - 8.5% (Paragraph 15, Budget Speech 2015-16).[i] Rather enthusiastically, the Finance Minister proclaimed that “Aiming for a double-digit rate seems feasible very soon”. However, the reality of GDP growth rate has turned out to be disappointing as Figure 1 shows.

While a growth rate of 7.56%, 7.78% and 7.26% over the three quarters of the current fiscal year is certainly not to be sniffed at, especially when the rest of the world including China is struggling to grow rapidly, it is not as high as the Budget 2015-16 had hoped for. That the hopes expressed in the Budget 2015-16 were exaggerated was well anticipated by many. This is what I wrote in the last paragraph of my blog-post of July 2015, I had stated “The various indicators that I have looked at lead me to believe that rate of growth of the Indian economy will, at best, be close to what we have already seen in 2014-15, that is, a rate of about 7.5%”.[ii] Pardon me for blowing my own trumpet, but it is not too often that one gets a forecast right; of course, if one does it get it right, then it must be made sure that everyone hears about it!!
THE WEAK UNDERBELLY
The question I wish to raise in this post is what is keeping the Indian economy ticking along? And, more importantly, can the economy keep up its rate of growth in spite of the weaknesses that I discuss now. The Mid-year Economic Analysis (2015-16) published by the Ministry of Finance in December 2015[iii] stated: “The remarkable thing about 2015-16 growth performance is that it continues to be as strong as it is given the weakness of exports (because of declining world markets) and private investment” (p. 11, para 1.24). Indian exports have been in free fall for many months now as Figure 2 shows.

The chart for exports shows that the performance of exports during the first year of the NDA government was worse than its performance during the last year of the UPA government. Disappointingly, the performance in the second year of NDA has been even worse with quarterly rates of growth being persistently negative. The Economic Survey 2015-16 offers the following to gloss over the disappointing performance of exports growth: “It is from this angle that the India's achievement of being able to sustain its growth at a fairly high level, primarily on the strength of her domestic absorption, becomes noteworthy”.[iv] The reference of the Economic Survey is, obviously, to the tough economic situation all over the world. It is true that world economic growth rate is estimated to be 3.1% in 2015.[v] But is it correct to blame the world situation for the woes of Indian exports since January 2015? As a point of comparison, world economic growth rate at the height of the Great Recession was 3.06% (2008) and 0.028% (2009)[vi] and the corresponding rate of growth of Indian exports was 23% and negative 2.1%, respectively. There was a clear discernible slowdown in 2009-10 when the world economy collapsed. With the world economic growth rates in excess of 3% over the last few years, surely the world situation is not as dire as it was around 2009 and 2010.
The Mid-year Review 2015 also makes a reference to the poor performance of private sector investment. Figure 3 shows the path of this component of GDP.
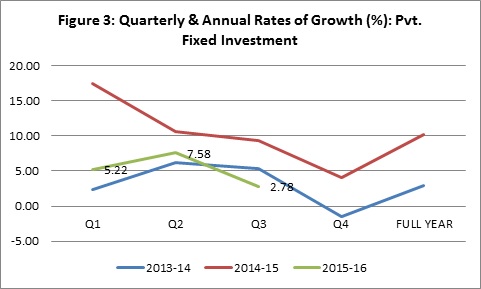
While the performance during the first year of the NDA government was very commendable, private investment seems to have run out of steam in the second year. This is indeed a worrying sign. The business sector has been very voluble in its praise of the Prime Minister but it has kept its wallets firmly closed.
SOMETHING POSITIVE
The NDA government’s arrival was greeted with enthusiasm and Narendra Modi’s ascent to the position was seen as a positive signal for the private sector to begin growing again after the lethargy during the last years of the UPA. That does not seem to have happened as yet. This is despite the fact that the World Bank’s Ease of Doing Business report for 2016 shows improvement as compared to the report for 2015. See Table 1.
Table 1: Ease of Doing Business in India
REGION
|
South Asia
|
DOING BUSINESS 2016 RANK
130
|
DOING BUSINESS 2015 RANK
134
|
CHANGE IN RANK
↑ 4
|
|||
INCOME CATEGORY
|
Lower Middle Income
|
||||||
POPULATION
|
1,267,401,849
|
DOING BUSINESS 2106 DTF (% POINTS)
54.68
|
DOING BUSINESS 2105 DTF (% POINTS)
52.67
|
CHANGE IN DTF POINTS
↑ 2.01
|
|||
GNI PER CAPITA (US$)
|
1,610
|
||||||
CITY COVERED
|
Mumbai, Delhi
|
Note: DTF = Distance to Frontier
|
|||||
Topics
|
DB 2016 Rank
|
DB 2015 Rank
|
Change in Rank
|
||||
Starting a Business
|
155
|
164
|
↑ 9
|
||||
Dealing with Construction Permits
|
183
|
184
|
↑ 1
|
||||
Getting electricity
|
70
|
99
|
↑ 29
|
||||
Registering property
|
138
|
138
|
No change
|
||||
Getting credit
|
42
|
36
|
↓ -6
|
||||
Protecting minority investors
|
8
|
8
|
No change
|
||||
Paying taxes
|
157
|
156
|
↓ -1
|
||||
Trading across borders
|
133
|
133
|
No change
|
||||
Enforcing contracts
|
178
|
178
|
No change
|
||||
Resolving insolvency
|
136
|
136
|
No change
|
||||
Source: Extracted from http://www.doingbusiness.org/data/exploreeconomies/india/
|
|||||||
Even though there is some improvement in the ease of doing business index, much remains to be done. Possibly, the change as yet is not significant enough to make an impact and some more improvement may be required before we begin to see evidence of it on the ground. Perhaps, this is what Kiran Muzumdar-Shaw means: “I have not seen any improvement in ease of doing business. It is as complex and, I think, the policies are as ambiguous and there is no consistency (sic)”.[vii]
The two factors that have sustained the GDP growth rate are government expenditure (especially government investments as the Mid-year Review of 2015-16 points on p. 11, para 1.26) and private consumption expenditure (p. 12, para 1.28).[viii] Figure 4 shows the performance of government expenditures.

Are there limits to how much government expenditures can be used to sustain GDP growth? Yes, there are: (1) adhering to the fiscal deficit target of 3.9% will impose a constraint and (2) Even more importantly, the RBI Governor has cautioned the government to not use government spending as a means of spurring economic growth.[ix]
The performance of the Finance Ministry in controlling the fiscal deficit has been commendable. The rate of growth of expenditures on the revenue account has been kept to a low of 3.2% during April-November (2015-16) as compared to the corresponding period in 2014-15. More impressively, the rate of growth of expenditures on the capital account has increased by 31% during the same period.[x] However, it should be remembered that one of the functions of capital expenditures by the government is that it should “crowd-in” private investment. It should not be seen as a substitute for private investment. However, the private sector continues to shy away from its investment function which has been a surprise, possibly, even for the government
Private consumption expenditure is the other component that has kept the rate of growth of GDP high. See Figure 5:

However, the signals to be read from the above figure are garbled as the next section discusses.
MIXED SIGNALS
Can private consumption drive growth of GDP in the years to come? There are a few worrying trends that I would like to point out in a couple of charts below. Of course, it needs to be remembered that the charts that I present below come from IIP (Index of Industrial Production) data and are not directly compared to the charts presented above which are from the National Accounts Statistics. It also bears remembering that IIP data are from the production side of the economy, while National Accounts data are from the consumption side. Hence, the two sources of data may not match perfectly but one would expect them to move in tandem.
Figures 6 and 7 give information on IIP for Consumer Goods as a whole and for IIP for Consumer Non-durables goods. The remaining part of consumer goods is consumer durables which makes a relatively small contribution (28%) to the IIP for Consumer Goods as compared to consumer non-durables which contribute 72%. It may be mentioned that consumer non-durables represents goods of essential consumption by a large mass of people.


These two figures tell a very dismal story of the state of Indian economy and, in many ways, contradict the story told by the high rate of growth of GDP. If private consumption is supposed to drive growth of GDP (as Figure 5 suggests) then Figure 6 completely contradicts this proposition. The average annualised rate of growth of consumer goods as per Figure 6 is 4.3% for the period April-December 2015. However, even this is misleading because of the massive spike in October 2015. The spike in October 2015 is a statistical artifact because it is computed relative to October 2014 which saw a huge fall of -18%. If the data for October 2015 is excluded, the rate of growth of IIP for Consumer Goods for April-December 2015 falls to 2.5%. The picture gets even murkier when we look at Figure 7. The average rate of growth of consumer non-durables over April-December 2015 is -0.8%. However, excluding October 2015 (for the same reasons as above) the rate of growth is -1.5%. Is this a pointer to rural distress that we have been seeing over the years and seems to be continuing relentlessly?[xi]
Those who use IIP data know that such data are noisy: there is much delay in data-collection, the coverage is often not complete and the data are subject to much revision. The question is which data does the Finance Minister rely on while framing the budget? It is not as if the GDP data are completely free of controversy. While the change of methodology introduced about a year ago for reporting GDP data has been welcomed, it has left confused even policy makers of repute such as Raghuram Rajan and Arvind Subramanian.[xii]
OTHER INDICATORS
Let us now consider some of the other indicators of the Indian Economy. Capital goods production seems to be suffering in line with the sluggish growth of private investment. Figure 8 points towards this.

Consumption and production of electricity should be closely related to the level of economic activity in the economy. Figure 9 shows the IIP for Electricity production.

In the case of IIP-Electricity, there was a sharp fall in the rate of growth in September 2014 which creates a sharp hike in September 2015. Ignoring this statistical anomaly, the rate of growth of electricity production is a mere 3.6%.
The Purchase Managers’ Index (PMI) is believed to be a leading indicator of economic activity in the economy .[xiii] If the value of PMI is more than 50, an expansion in the economy is indicated while a value below 50 signals a contraction. Figure 10 gives the PMI for manufacturing in India.

While 2014-15 showed robust levels of PMI, the performance of in 2015-16 has been far more sedate. In fact, for November 2015 the PMI slipped below 50, which suggests a contraction.
An alternative leading indicator of the state of the economy is non-food credit disbursed by commercial banks. Such credit is meant for Agriculture and Allied Activities, Industry, Services and Personal Loans. Figure 11 gives details.

The performance of non-food credit is certainly better than it was in 2014-15 but still much below that in 2013-14. Raghuram Rajan, Governor of the Reserve Bank of India, points out that “Non-food credit growth from public sector banks, the more stressed part of the system, grew at only 6.6% over the calendar year 2015”.[xiv] More importantly, he points out that “The only area of strength was personal loans, where growth was 16.9 %”. Since non-food credit as depicted in Figure 11 includes personal loans, it would be interesting to look at non-food credit growth excluding personal loans. I do this in Figure 12.

What we see is that there is hardly any effect on the rate of growth of non-food credit (excluding personal loans) for the UPA year (2013-14). However, the performance deteriorates significantly during the NDA years of 2014-15 and 2015-16. For the period April-December 2015, the rate of growth is around 7% only. Possible reason for this has been pointed out by Raghuram Rajan: “The most plausible explanation I have is that the stressed balance sheet of public sector banks is occupying management attention and holding them back, and the only way for them to supply the economy’s need for credit, which is essential for higher economic growth, is to clean up”. This clean up, according to him, will require a surgery rather than a band-aid! However, this is unlikely to happen soon and will require strong measures in the Budget 2016-17. In the meantime, the pace of growth of the Indian economy will continue to languish at the levels we have seen so far.
SUMMING UP
The NDA government is close to completing two years of its current term. There have been some positives that have occurred during this time which must be mentioned: (a) ease of doing business has improved (2) India’s rank in the Corruption Perceptions Index has improved from 86 in 2014 to 76 in 2015[xv] (3) management of public finances has been commendable with deficit targets likely to be met and greater emphasis on capital expenditures as opposed to expenditures on the revenue account (4) rates of interest have come down largely because the government has managed to keep inflation in check.
The problems with the economy have been elaborated above. The question is what is the Budget 2016-17 going to do about it? In many ways, this is perhaps a very critical budget: history tells us that a government is a "reformist" in its initial two years but after that its eyes are firmly fixed on the next elections. The government and its supporters may blame the opposition (notably, the Congress) for obstructing many important reforms (e.g. the GST Bill) but that, I believe, is a weak excuse. The NDA is the strongest government (in terms of majority in Parliament) in the last 30 years and much was expected from it. In fact, both Vajpayee’s NDA government and Narsimha Rao’s UPA government were much weaker but did manage to pass critical bills in the Parliament. The problem with the current NDA government is its confrontational attitude even at the cost of wasting precious parliamentary sessions. The aggressive histrionics of Smriti Irani in Parliament on 24 February 2016 has probably set the 2016 Budget session of parliament on a trajectory where competitive politics will once trump any serious attempt at policy making. When the history of Indian parliament is written, the current government will be in the dock for squandering its position of strength and for its inability to co-opt the support of opposition parties in the passing of important bills. My worry is that the BJP, and especially its Prime Minister, is far too obsessed with the Congress. In a democracy, it is perfectly reasonable to expect that a political party will try its utmost to defeat its rival in elections. I get the feeling that the BJP, having defeated the Congress in the 2014 elections, now wishes to completely destroy it. This, I believe, can only weaken Indian democracy even though it may strengthen the BJP. Apart from the committed supporters of the BJP, such a scenario is unlikely to be welcomed by the rest of the electorate.