Thursday 26 September 2019

Supply-side solutions for Demand-side Problems


Introduction

The flurry of reforms unleashed in the last few weeks suggests that the Government has finally accepted that the Indian economy is in trouble. The changes have been so dramatic that the Economic Times called it the “3rd Budget in 8 months”.[i] Of course, there is a disconnect between what the government says and what it does: even as the Finance Minister Nirmala Sitharaman announced changes to the FDI policy in August, she claimed that the Indian economy was doing very well.[ii] Never mind. The ruling BJP has its compulsions: it needs to keep its flock together and, hence, needs to paint a rosy picture of how well the economy is doing.

For months, economists and other responsible analysts had been pointing to the alarming state of the economy. 
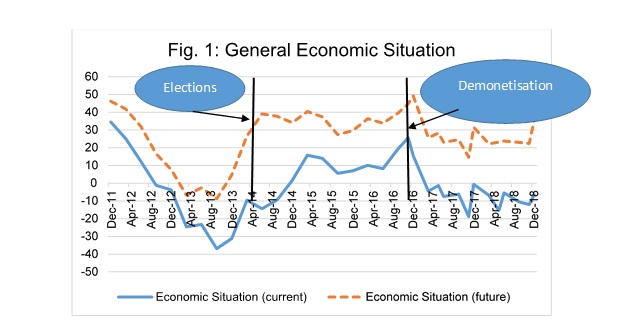
Despite all the misgivings about the GDP especially after the base change and after numerous revisions,[iii] I use quarterly growth rates of GDP in Figure 1 below to capture in summary form the problems facing the economy.


The growth rate in 2019-20Q1 at 4.89% is the worst that the economy has performed since 2012-13Q4 when it was 4.21%. The BJP might still find solace in the fact that its worst performance is still better than the worst performance during the UPA rule. However, just the fact that one has to search for the worst performance of the UPA to make the latest growth rate look good shows the magnitude of the problem.  In addition to the falling growth rate, analysts have drawn attention to other grave problems: (a) unemployment[iv] [v] (b) stagnant rural incomes[vi] (c) falling consumption[vii] (d) falling investments.[viii] The combination of stagnant rural incomes, stagnant consumption and investment levels coupled with low inflation suggests that the primary cause of the slowdown in India is inadequate demand.[ix] Combating such a slowdown in the economy requires demand-side policies, such as, increases in government expenditure. This might well have an adverse effect on the quantum of fiscal deficit but, if the economy revives and GDP increases at a faster rate than it currently is, the fiscal deficit to GDP ratio may not experience too large an increase.

Flurry of Reforms
In response to the slowing down of the economy the government has announced a series of measures:
  1. Merger of banks, which has reduced the number of public sector banks from 27 to 12.[x]
  2.  Foreign Direct Investment: On 28 August 2019, the Finance Minister announced changes in the FDI policy which would now permit single-brand retail to commence online retail trading prior to opening of physical stores provided physical stores begin operations within two years of commencement on online operations.[xi] This is a major change since single brand retail FDI has been a “political hot potato” which no government had embraced so far.[xii]
  3.  Loan Melas: The Finance Minister has urged public sector banks to hold “loan melas" (loans festival) in 400 districts across the country.[xiii]
  4. Tax Rates: The biggest announcement has been the reduction in corporate tax rate from a highest rate of almost 35% to about 25%.[xiv]

The important question is whether there is a correspondence between the problems facing the Indian economy and the policy measures that have been announced. As stated above, the problem facing the economy is one of inadequacy of demand. Do the policies that have been announced address the problem of demand deficiency? I have my doubts especially because the measures announced are in the nature of supply-side policies.

Supply-side policies

Supply side policies are designed to increase the potential output of an economy.[xv] In general, such policies affect an economy’s long run economic growth. Supply side policies typically involve reduced government expenditure, tax cuts for labour and business and policies designed to increase competition. Of course, the approach to supply-side policy has to be nuanced; for example, which type of government expenditure is reduced matters.

Considering the various measures that have been introduced in the recent past one could identify the following:
  1. Merger of banks: supply side measure to increase competitiveness
  2. Foreign Direct Investment: supply side measure to increase competitiveness
  3. “Loan melas": assuming that loans are actually given out, this is likely a demand side measure
  4. Cut in corporate tax rates: standard supply side policy

Barring “loan melas” all the others are supply side policies which are expected to increase long run economic growth. No doubt this is important but does it address the problems that the economy is facing? The hope of the supply side policies – especially FDI and tax cuts – that have been introduced is that foreign and domestic investment will revive which will lead to more employment and which will result in higher production which in turn will lead to more investment, more employment and so on in a virtuous cycle. The question is whether investment will work as an autonomous driver in a demand deficient economy. If producers are not confident about selling their products – remember the problems being faced by Parle-G biscuits as well as other FMCG products[xvi] and Maruti Suzuki cars?[xvii] – would they take the risk of investing? The tax cuts that have been announced will have immediate beneficial effect only if the money is spent on additional investment. In the absence of that, it is merely a bonanza for companies and huge strain on the public finances.  

Fiscal Multipliers

A change in fiscal policy (change in government expenditures or change in taxes) has an impact on GDP. The size of this impact is measured by the multiplier.[xviii] It may be noted that a change in taxes or a change in expenditure has an impact on the fiscal deficit which is defined (in simple terms) as:

Fiscal Deficit = Government Expenditure – Government Revenues

Expenditures include both capital and current account expenditures while government revenues include tax revenues, non-tax revenues and other non-debt-creating revenues (e.g. disinvestment proceeds).

The recent reduction in corporate taxes is expected to reduce tax revenues by Rs. 1.45 lakh crore. Keeping government expenditures constant, fiscal deficit will rise by the same amount. However, if the government wishes to keep fiscal deficit constant, expenditures must be reduced by the same amount that taxes have gone down. It may be noted that a reduction in taxes and increase in expenditures are said to be expansionary i.e. they are designed to expand the economy. The question is, by how much? This is computed by reference to the multiplier. Denoting government expenditures as G and tax revenues as T, the relationship between GDP and G or GDP and T is given by:

  1. Change in GDP = (expenditure multiplier)*(change in G)
  2. Change in GDP = (tax multiplier)*(change in T)


It can be shown that the tax multiplier is smaller than the expenditure multiplier. Hence, for a unit change in expenditure, the change in GDP will be greater than for a unit change in taxes. Bose and Bhanumurthy of NIPFP have estimated that the multiplier associated with capital expenditure is as high as 2.45. [xix] If instead of cutting taxes to the extent of Rs. 1.45 lakh crore, the same amount had been spent of capital expenditure, GDP would have risen by Rs. 3.55 lakh crore. Bose and Bhanumurthy estimates for the multiplier associated with the corporate tax indicate that for the Rs. 1.45 lakh crore cut in taxes, GDP will increase by the same amount. Clearly, you get more bang for the bucks with a unit change (i.e. increase) in expenditures than for a unit change (i.e. decrease) in taxes.

Conclusions

In conclusion, I will summarise my evaluation of the recent policy changes:

  1. The problems facing the Indian economy have arisen due to a deficiency of demand and, hence, solving these required that demand-side policies be enacted
  2. Unfortunately, the government has enacted supply-side policies which will be beneficial in the long run by raising India’s potential output. However, it may not do anything to reverse the slowdown in the economy.
  3. Reducing taxes as an expansionary measure does not have as much of an impact as raising government expenditures due to the much smaller multiplier effect.
  4. If government expenditures are reduced to keep the fiscal deficit at its announced level, the economy will face a further problems. Note that the expenditure multiplier works in reverse as well and a reduction in expenditures will reduce GDP. In the current context, if expenditures are cut by Rs. 1.45 lakh crore, GDP will fall by Rs. 3.55 lakh crore. Coupling this with the increase in GDP due to the tax cut, the net effect on GDP will be a fall of Rs. 2.1025 lakh crore. This is bound to worsen the economic situation in India.


[iii] Do listen to this very informative podcast: http://www.seenunseen.in/episodes/2019/7/22/episode-130-demystifying-gdp

Wednesday 3 April 2019

2019 ELECTIONS: Will Perceptions About the Economy matter?


Introduction

Examining the determinants, specifically economic determinants, of elections has been an important research activity in the discipline of public choice. Around election times, not just economists, but talking heads on TV channels seek to divine the outcome of elections on the basis of a smorgasbord of economic and other determinants. Many of them, possibly without knowing it, are being influenced by Edward Tufte’s oft-quoted statement: “When you think economics, think elections; when you think elections, think economics” [2].

The literature in this area distinguishes between Vote Functions and Popularity Functions. In estimating popularity functions, one tries to estimate the approval rating of the government or the political party in power while vote functions seek to explain the voting choice itself [3]. As an election approaches, but before the voting actually begins, the agenda is to gauge the popularity of the incumbent political party on the basis of its performance. Performance is generally evaluated on the basis of the actual state of the economy as conveyed by data on macroeconomic variables. Vote functions are estimated after the event to try and understand voting behavior and to determine which factors might have been important in the voters’ choice. Even though popularity functions have been estimated for a long time, especially in the United States, there is no consensus on which macroeconomic variables have a predictable impact on the popularity of the government [4]. Nate Silver makes a similar point [5]. Over time, popularity functions have progressed from using actual data on macroeconomic variables to voters’ perceptions about the state of economy. It is worth pondering whether the subjective perceptions about the state of economy match the actual state of the economy as evidenced by hard data.

Estimating popularity functions for India is not well-established because sufficiently long time series data are not yet available. However, since 2011, the Reserve Bank of India has been carrying out Consumer Confidence Surveys (CCS) [6]. The CCS of September 2011 described the exercise as follows: “It [CCS] gives an assessment of the consumer sentiments of the respondents based on their perceptions of the general economic conditions and own financial situation. The assessments are analysed in two parts, viz., current situation as compared to a year ago and expectations for a year ahead” [7]. However, estimating popularity functions is hampered due to the paucity of data on the popularity of the government or the ruling party. Lokniti has been reporting such data in its Mood of the Nation surveys [8]. However, the time series is not long enough to estimate popularity functions. More than twenty-five years ago, in one of the earliest studies in the area, I had tried to estimate popularity of the government using bye-election results [9]. However, bye-elections do not take place at regular intervals making it difficult to relate popularity of the government using bye-elections with macroeconomic data – whether actual data or perceptions of such data – that have been collected at regular intervals of time.

RBI Consumer Confidence Surveys

The earliest RBI Consumer Confidence Surveys is for September 2011 [10]. This CCS covered the cities of Bangalore, Chennai, Hyderabad, Kolkata, Mumbai and New Delhi. 900 respondents were selected from each city yielding a sample of 5,400 respondents. Over the years, the coverage of the CCS has increased and the last one available for December 2018 covered 13 cities – Ahmedabad, Bengaluru, Bhopal, Chennai, Delhi, Guwahati, Hyderabad, Jaipur, Kolkata, Lucknow, Mumbai, Patna and Thiruvananthapuram - and obtained 5,347 responses [11]. The questions asked of respondents covered the following topics:

1.    Perceptions and Expectations on General Economic Situation
2.    Perceptions and Expectations on Employment
3.    Perceptions and Expectations on Price Level
4.    Perceptions and Expectations on Rate of Change in Price Level (Inflation)
5.    Perceptions and Expectations on Income
6.    Perceptions and Expectations on Spending
7.    Perceptions and Expectations on Spending- Essential Items
8.    Perceptions and Expectations on Spending- Non-Essential Items

Perceptions are about the current situation and respondents are asked if they believe there has been an improvement, a worsening or no change as compared to a year ago. The percentage of respondents who state that there is a worsening is subtracted from the percentage of those who state there is an improvement while ignoring those who feel there has been no change. This difference is labelled Net Response (NR), a positive value of which suggests an overall improvement while a negative value suggests a worsening situation. Expectations are generally in terms of anticipated changes over the next one year for which as well the NR is computed [12].

Reading the Tea Leaves…

In this section, I try to make some sense of the results of the RBI’s CCS. To begin with let us consider the General Economic Situation.

General Economic Situation

Figure 1 shows the NR for the current situation and for expectations.


The dismal NR for the current economic situation in the last few quarters of the UPA regime before the 2014 Elections was a clear indication of imminent change. For over a year after the 2014 Elections, there was a significant improvement in NR till the economy was hit by the shock of Demonetisation. NR plummeted in the post-demonetisation period reaching negative values. There is much greater optimism regarding the future economic situation with a large percentage of respondents expecting an improved economic situation one year down the line.

The pessimism about the current economic situation is not as bad as it was just prior to the elections of 2014 but it should be remembered that the UPA was facing those elections after having ruled the country for ten years. The NDA, which has had the largest majority in Parliament in 30 years, is facing a pessimistic electorate at the end of only its first term in office. Table 1 shows the comparison between UPA and NDA regimes.

Table 1: General Economic Situation – Average Net Response
General Economic Situation (current)
General Economic Situation (future)
UPA: ONE YEAR PRIOR TO 2014 ELECTIONS
-25.12
2.62
NDA: BEFORE DEMONETISATION
7.59
36.39
NDA: AFTER DEMONETISATION
-6.17
26.69

  
Table 1 shows that the pessimism at the end of UPA’s rule was much deeper than it is for the NDA and this was true for both the current and the future economic situation. Nonetheless it is not a comfortable situation for the NDA and this is seen in the anxiety, especially of the BJP, to steer the conversation away from the economy towards issues related to national security and nationalism. But more on that later.

Employment

In Figure 2, I look at the CCS component on employment.


The pessimism with respect to current employment is the worst that it has been seen since the start of CCS. In fact, the NR for current employment turned negative in the survey of March 2016 but, surprisingly, it was positive at 6.2 in November 2016, the month in which demonetisation was announced. After demonetisation, the NR has been persistently negative. This lends substantial credibility to the estimates of the NSSO that unemployment in India has reached a 45 year high [13]. Expectations of employment have also been lowered in the aftermath of demonetisation.

Table 2 presents a comparison of the situation with respect to employment during the UPA and NDA regimes.

Table 2: Employment Situation – Average Net Response
Employment Situation (current)
Employment Situation (future)
UPA: ONE YEAR PRIOR TO 2014 ELECTIONS
1.58
25.24
NDA: BEFORE DEMONETISATION
3.75
38.85
NDA: AFTER DEMONETISATION
-10.25
28.35

The average NR with respect to current employment situation during the post-demonetisation period is much worse than that seen towards the end of the UPA regime. Even as far as employment prospects are concerned, there is 10 percentage points drop in the score – from 38.85 to 28.35 – between the two periods of the NDA rule.

Income

Finally, in Figure 3, Net Responses for Income are presented.


The fall in perceptions about current income does not sit well with the claims that India has been growing at a rapid rate during the NDA rule. Perhaps, there is some truth in Raghuram Rajan’s doubts about whether India is growing at 7% per annum at all [14]. NR for future incomes, however, show a rise from December 2017.

Table 3 presents a comparison of the UPA and NDA regimes for the income situation.

Table 3: Income Situation – Average Net Response
Income (current)
Income (future)
UPA: ONE YEAR PRIOR TO 2014 ELECTIONS
22.24
40.88
NDA: BEFORE DEMONETISATION
16.73
46.59
NDA: AFTER DEMONETISATION
2.80
42.56

The average NR for current income at 2.80 is the lowest in the three time periods considered in Table 3.

Conclusions

Questions may be asked whether the respondents are misreading the economy and whether their pessimistic perceptions are not a sign of inadequate information as well inadequate information processing. That may well be true and this becomes evident from the Net Responses for inflation and price level (not reported here). The NR for both have been negative right from the first survey till the latest. While negative NR might have been appropriate during the UPA regime when inflation was running high, these may be mistaken for the NDA regime when inflation has come down substantially. Howsoever mistaken the perceptions might be, political parties have to live with these: if the economy matters in the voters’ decision making, perceptions will play a more dominant role than “objective” reality or hard data. As “Kahneman and Tversky showed that…human beings hardly behave as if they were trained or intuitive statisticians” [15].

It is now reasonably well-established in the literature that the state of the economy is always a pertinent issue in any election campaign [16]. In this context, the responsibility hypothesis of Lewis-Beck and Paldam tells us that voters hold the government responsible for economic events and that we can bring into the picture voter perceptions of the economy [17]. Negative perceptions about the state of the economy spell trouble for any incumbent as the UPA found out in the previous elections. The NDA government also faces negative perceptions about the handling of the economy especially with respect to employment. The question remains whether voters are sufficiently disenchanted with the present government to vote it out. That is a difficulty question to answer for a variety of reasons.

1. We do not know how exactly perceptions about the economy are transformed into voting 
    decisions: the paucity of data do not allow us to make any inference.
Voting out the government requires an alternative who can capture the negative votes
    against the government
3. Non-economic issues gain prominence over economic issues deflecting attention away
   from the negative perceptions

For the NDA government, issues surrounding voter perceptions are not academic but rather existential issues. If there is the slightest risk that negate perceptions might harm its re-elections prospects, it must (and it has been doing so!) bring to prominence non-economic issues that steer the discussion away from economic issues. Of course, to be on the safe side, the government has suppressed unpalatable data (e.g. NSSO report on unemployment) and it has also got the Niti Ayog to massage the GDP data in such a way that the NDA performance seems better than that of the UPA.

Sometimes fate intervenes to give the incumbent an advantage: the Pulwama terror attack, however tragic and ghastly it undoubtedly was, did give the BJP the opportunity to display its muscular nationalism. For the past several weeks, the campaign battle has seen the opposition parties seeking to focus attention towards the economy while the BJP has been dragging the conversation towards nationalism and security. In Narendra Modi the opposition is facing a master campaigner who is not above twisting facts so as to put the opposition on the defensive. Likewise, genuine questions to the government have been mauled out of context to extract political mileage. For example, questions about BJP’s claims about casualties in the air strike in Balakot [18] were falsely portrayed as the opposition questioning the Indian armed forces [19]. This is such a far cry from the strategy followed by Mr. Narendra Modi in 2014 when catch phrases such as ‘Achhe Din’ and ‘Sab ka saath, sab ka vikas’ rent the air. As Shekhar Gupta correctly puts it, for the 2019 elections, Mr. Modi is not seeking votes on the basis of his government’s economic performance but on the basis of national security [20].

Will the BJP’s messaging and rhetoric on nationalism be sufficient to divert attention away from its obvious failings on the economic front? Will the opposition be able to drag back the discourse towards economic issues? And, most importantly, how will the mix of economic and non-economic issues play out in the minds of voters as their hands hover over Electronic Voting Machines in polling booths across India?  We will get our answer by the middle of May 2019.

ENDNOTES:

1.       I would like to thank Manali Phatak for collecting and organizing the data on RBI’s Consumer Confidence Surveys.
2.    Tufte, E.R. (1978) Political Control of the Economy, Princeton University Press, Princeton, NJ, USA.
3.    Lewis-Beck, M.S. and Stegmaier, M. (2013) The VP-function revisited: a survey of the literature on vote and popularity functions after over 40 years, Public Choice, Vol. 157, No. 3/4, pp. 367-385 (https://www.jstor.org/stable/24507619?seq=1#page_scan_tab_contents)
4.    Lewis-Beck and Stegmaier (2013) ibid.
5.    Nate Silver (2012)Measuring the Effect of the Economy on Elections https://fivethirtyeight.blogs.nytimes.com/2012/07/05/measuring-the-effect-of-the-economy-on-elections/
6.    Reserve Bank of India (various years) Consumer Confidence Survey, https://rbi.org.in/Scripts/QuarterlyPublications.aspx?head=Consumer%20Confidence%20Survey
7.       Reserve Bank of India (2011) Consumer Confidence Survey : September 2011, https://rbi.org.in/Scripts/PublicationsView.aspx?id=14028
8.   Lokniti (2017) Mood of the Nation Surveys, https://www.lokniti.org/other-studies
9.   Karnik, A. (1990) “Elections and Government Expenditures: The Indian Evidence”, Journal of Quantitative Economics, Vol. 6, pp. 203-212
10. RBI (2011) Consumer Confidence Survey : September 2011, https://rbi.org.in/Scripts/PublicationsView.aspx?id=14028
11. RBI (2019) Consumer Confidence Survey: December 2018, https://rbi.org.in/Scripts/PublicationsView.aspx?id=18776
12. The methodology of analyzing the CCS is given here: https://rbi.org.in/Scripts/PublicationsView.aspx?id=14028#A2 in Annex II.
13. Sharad Raghavan, T.C.A. and Jebaraj, P (2019) National Sample Survey Office’s unemployment data confirms crisis on the ground: experts, https://www.thehindu.com/news/national/national-sample-survey-offices-unemployment-data-confirm-crisis-on-the-ground-experts/article26141744.ece
14. Economic Times (2019) Raghuram Rajan raises doubts about India growing at 7%, says cloud over GDP data needs to be cleared, https://economictimes.indiatimes.com/news/economy/indicators/raghuram-rajan-raises-doubts-about-india-growing-at-7-says-cloud-over-gdp-data-needs-to-be-cleared/articleshow/68581012.cms
15. Sunstein, C.R. and Thaler, I (2016) The Two Friends Who Changed How We Think About How We Think, The New Yorker, December 7, https://www.newyorker.com/books/page-turner/the-two-friends-who-changed-how-we-think-about-how-we-think
18. Langa, M. (2019) Air strike killed more than 250 terrorists, says Amit Shah, The Hindu, March 4 2019, https://www.thehindu.com/news/national/other-states/air-strike-killed-more-than-250-terrorists-says-amit-shah/article26430065.ece
19. DD News (2019) FM Arun Jaitley slams those who question armed forces, http://ddnews.gov.in/national/balakot-airstrike-was-not-revenge-action-fm-arun-jaitley
20. Gupta, S. (2019) Modi’s 2019 mantra: Forget achhe din, fear terror, Pakistan, Muslim, The Print, https://theprint.in/national-interest/modis-2019-mantra-forget-achhe-din-fear-terror-pakistan-muslim/214495/